
티스토리 뷰
개요
Kubernetes는 수 많은 객체들의 집합으로 구성되어 있으며, 이는 확장성 가능하게 구성되어 클러스터 내 장애 상황을 식별하는 것은 굉장히 번거로운 일이라고 볼 수 있다. 이로 인해 Kubernetes 클러스터 내의 다양한 각도에서 모니터링할 수 있는 환경을 구성하는 것은 장애 발생으로 인한 가동 중지 시간을 줄이거나 피할 수 있다. 대표적인 장애 상황은 다음을 예로 들 수 있다.
- 노드 문제 : 실패 상태의 Docker 데몬/Kubelet, CNI 실패로 인한 할당되지 않은 IP 주소 등
- 포드 문제 : Health Check 실패, Running 상태가 아닌 포드 등
- 네임스페이스 문제 : Pod를 배치할 수 없는 Namespace
- DNS 확인 문제 : CoreDNS lookup 실패
- 네트워크 문제 : 네트워크 정책 변경 등
Kuberhalthy는 모니터링 및 지속적인 프로세스 검증을 위한 Kubernetes Operator이다. Kuberhealthy가 제공하는 Synthetic Check는 khcheck/khjob이라는 사용자 지정 리소스에 의해 생성된 테스트 컨테이너이다. Check가 생성되면 Kuberhealthy는 주어진 간격과 제한 시간 내에 모든 검사를 예약한다. khjob이 한 번 실행되는 반면 khcheck는 정기적인 간격으로 실행된다는 점을 제외하면 기능면에서 거의 동일하다.
"Kubernetes Operator는 Kubernetes 코드 자체를 수정하지 않고도 컨트롤러를 하나 이상의 사용자 정의 리소스(custom resource)에 연결하여 클러스터의 동작을 확장할 수 있다. 오퍼레이터는 사용자 정의 리소스의 컨트롤러 역할을 하는 쿠버네티스 API의 클라이언트이다."
Kuberhealthy는 특정 khcheck에 해당하는 Checker Pod를 프로비저닝한다. 목적이 달성되면 Checker Pod는 삭제된다. 생성/삭제 주기는 khcheck 구성에서 runInterval/timeout의 지속 시간에 따라 일정한 간격으로 반복된다. 결과는 Kuberhealthy로 전송되고 Kuberhealthy는 이를 모니터링을 위해 Prometheus와 통합하거나 JSON 기반 상태 페이지에서 확인할 수 있다.
Kuberhealthy 설치
1. kube-prometheus-stack 설치
a. namespace 생성
[root@ip-192-168-78-195 ~ (iam-root-account@NRSON-EKS-CLUSTER.ap-northeast-2.eksctl.io:default)]# kubectl create namespace monitoring
namespace/monitoring created
[root@ip-192-168-78-195 ~ (iam-root-account@NRSON-EKS-CLUSTER.ap-northeast-2.eksctl.io:default)]# kubectl config set-context --current --namespace=monitoring
Context "iam-root-account@NRSON-EKS-CLUSTER.ap-northeast-2.eksctl.io" modified.
[root@ip-192-168-78-195 ~ (iam-root-account@NRSON-EKS-CLUSTER.ap-northeast-2.eksctl.io:monitoring)]#
b. kube-prometheus-stack 설치
[root@ip-192-168-78-195 ~ (iam-root-account@NRSON-EKS-CLUSTER.ap-northeast-2.eksctl.io:monitoring)]# helm repo add prometheus-community https://prometheus-community.github.io/helm-charts
"prometheus-community" already exists with the same configuration, skipping
[root@ip-192-168-78-195 ~ (iam-root-account@NRSON-EKS-CLUSTER.ap-northeast-2.eksctl.io:monitoring)]# helm repo update
Hang tight while we grab the latest from your chart repositories...
...Successfully got an update from the "nfs-subdir-external-provisioner" chart repository
...Successfully got an update from the "kuberhealthy" chart repository
...Successfully got an update from the "prometheus-community" chart repository
Update Complete. 뉸appy Helming!
[root@ip-192-168-78-195 ~ (iam-root-account@NRSON-EKS-CLUSTER.ap-northeast-2.eksctl.io:monitoring)]# helm install prometheus prometheus-community/kube-prometheus-stack
NAME: prometheus
LAST DEPLOYED: Tue Apr  5 03:25:09 2022
NAMESPACE: monitoring
STATUS: deployed
REVISION: 1
NOTES:
kube-prometheus-stack has been installed. Check its status by running:
  kubectl --namespace monitoring get pods -l "release=prometheus"

Visit https://github.com/prometheus-operator/kube-prometheus for instructions on how to create & configure Alertmanager and Prometheus instances using the Operator.
[root@ip-192-168-78-195 ~ (iam-root-account@NRSON-EKS-CLUSTER.ap-northeast-2.eksctl.io:monitoring)]#
c. 설치 확인
[root@ip-192-168-78-195 ~ (iam-root-account@NRSON-EKS-CLUSTER.ap-northeast-2.eksctl.io:monitoring)]# kubectl get svc -n monitoring
NAME                                      TYPE        CLUSTER-IP       EXTERNAL-IP   PORT(S)                      AGE
alertmanager-operated                     ClusterIP   None             <none>        9093/TCP,9094/TCP,9094/UDP   12s
prometheus-grafana                        ClusterIP   10.100.207.52    <none>        80/TCP                       22s
prometheus-kube-prometheus-alertmanager   ClusterIP   10.100.88.52     <none>        9093/TCP                     22s
prometheus-kube-prometheus-operator       ClusterIP   10.100.132.210   <none>        443/TCP                      22s
prometheus-kube-prometheus-prometheus     ClusterIP   10.100.206.148   <none>        9090/TCP                     22s
prometheus-kube-state-metrics             ClusterIP   10.100.190.195   <none>        8080/TCP                     22s
prometheus-operated                       ClusterIP   None             <none>        9090/TCP                     12s
prometheus-prometheus-node-exporter       ClusterIP   10.100.243.19    <none>        9100/TCP                     22s
[root@ip-192-168-78-195 ~ (iam-root-account@NRSON-EKS-CLUSTER.ap-northeast-2.eksctl.io:monitoring)]# k get service prometheus-kube-prometheus-prometheus -n monitoring
NAME                                    TYPE        CLUSTER-IP       EXTERNAL-IP   PORT(S)    AGE
prometheus-kube-prometheus-prometheus   ClusterIP   10.100.206.148   <none>        9090/TCP   40s
[root@ip-192-168-78-195 ~ (iam-root-account@NRSON-EKS-CLUSTER.ap-northeast-2.eksctl.io:monitoring)]# k get service prometheus-grafana -n monitoring
NAME                 TYPE        CLUSTER-IP      EXTERNAL-IP   PORT(S)   AGE
prometheus-grafana   ClusterIP   10.100.207.52   <none>        80/TCP    3m14s
[root@ip-192-168-78-195 ~ (iam-root-account@NRSON-EKS-CLUSTER.ap-northeast-2.eksctl.io:monitoring)]#
d. Prometheus & Grafana 대시보드 접속
Grafana는 default ID : admin, PW : prom-operator로 로그인할 수 있다.
2. kuberhealthy 설치
a. namespace 생성
[root@ip-192-168-78-195 ~ (iam-root-account@NRSON-EKS-CLUSTER.ap-northeast-2.eksctl.io:monitoring)]# kubectl create ns kuberhealthy
namespace/kuberhealthy created
[root@ip-192-168-78-195 ~ (iam-root-account@NRSON-EKS-CLUSTER.ap-northeast-2.eksctl.io:monitoring)]# kubectl config set-context --current --namespace=kuberhealthy
Context "iam-root-account@NRSON-EKS-CLUSTER.ap-northeast-2.eksctl.io" modified.
[root@ip-192-168-78-195 ~ (iam-root-account@NRSON-EKS-CLUSTER.ap-northeast-2.eksctl.io:kuberhealthy)]#
b. kuberhealthy 설치
[root@ip-192-168-78-195 ~ (iam-root-account@NRSON-EKS-CLUSTER.ap-northeast-2.eksctl.io:kuberhealthy)]# helm repo add kuberhealthy https://comcast.github.io/kuberhealthy/kuberhealthy/helm-repos
"kuberhealthy" already exists with the same configuration, skipping
[root@ip-192-168-78-195 ~ (iam-root-account@NRSON-EKS-CLUSTER.ap-northeast-2.eksctl.io:kuberhealthy)]# helm repo update
Hang tight while we grab the latest from your chart repositories...
...Successfully got an update from the "nfs-subdir-external-provisioner" chart repository
...Successfully got an update from the "kuberhealthy" chart repository
...Successfully got an update from the "prometheus-community" chart repository
Update Complete. 뉸appy Helming!
[root@ip-192-168-78-195 ~ (iam-root-account@NRSON-EKS-CLUSTER.ap-northeast-2.eksctl.io:kuberhealthy)]# helm install kuberhealthy kuberhealthy/kuberhealthy --set prometheus.enabled=true,prometheus.enableAlerting=true,prometheus.serviceMonitor.enabled=true
W0405 06:58:25.676172   10155 warnings.go:70] policy/v1beta1 PodDisruptionBudget is deprecated in v1.21+, unavailable in v1.25+; use policy/v1 PodDisruptionBudget
W0405 06:58:26.133098   10155 warnings.go:70] policy/v1beta1 PodDisruptionBudget is deprecated in v1.21+, unavailable in v1.25+; use policy/v1 PodDisruptionBudget
NAME: kuberhealthy
LAST DEPLOYED: Tue Apr  5 06:58:25 2022
NAMESPACE: kuberhealthy
STATUS: deployed
REVISION: 1
TEST SUITE: None
[root@ip-192-168-78-195 ~ (iam-root-account@NRSON-EKS-CLUSTER.ap-northeast-2.eksctl.io:kuberhealthy)]#
c. 설치 확인
[root@ip-192-168-78-195 ~ (iam-root-account@NRSON-EKS-CLUSTER.ap-northeast-2.eksctl.io:kuberhealthy)]# kubectl get svc
NAME             TYPE        CLUSTER-IP      EXTERNAL-IP   PORT(S)   AGE
deployment-svc   ClusterIP   10.100.178.80   <none>        80/TCP    31s
kuberhealthy     ClusterIP   10.100.143.56   <none>        80/TCP    97s
[root@ip-192-168-78-195 ~ (iam-root-account@NRSON-EKS-CLUSTER.ap-northeast-2.eksctl.io:kuberhealthy)]# kubectl get pods
NAME                             READY   STATUS      RESTARTS   AGE
daemonset-1649141932             0/1     Completed   0          97s
deployment-1649141933            0/1     Completed   0          96s
dns-status-internal-1649141933   0/1     Completed   0          96s
kuberhealthy-7977cc6fcf-cbq4g    1/1     Running     0          2m8s
kuberhealthy-7977cc6fcf-m7zcl    1/1     Running     0          2m8s
[root@ip-192-168-78-195 ~ (iam-root-account@NRSON-EKS-CLUSTER.ap-northeast-2.eksctl.io:kuberhealthy)]#
khchecks와 관련된 포드는 Completed상태여야 한다. kuberhealthy 네임스페이스에는 기본적으로 3개의 khchecks가 설치되어 있어야 한다. khcheck는 테스트를 실행하기 위해 클러스터에서 Kuberhealthy가 생성한 사용자 지정 리소스이다.
[root@ip-192-168-78-195 ~ (iam-root-account@NRSON-EKS-CLUSTER.ap-northeast-2.eksctl.io:kuberhealthy)]# kubectl get khchecks
NAME                  AGE
daemonset             107s
deployment            107s
dns-status-internal   107s
[root@ip-192-168-78-195 ~ (iam-root-account@NRSON-EKS-CLUSTER.ap-northeast-2.eksctl.io:kuberhealthy)]#- daemonset : 클러스터의 모든 노드가 작동하는지 확인하기 위해 daemonset을 배포.
- deployment : deployment를 생성한 다음 rolling update를 트리거. service를 통해 deployment에 연결할 수 있는지 테스트한 후 테스트 pod를 complete 처리. 문제가 발생하면 failure 처리.
- dns-status-internal : Internal Cluter DNS가 정상 동작하는지 확인.
3. kuberhealthy Prometheus 연동
a. servicemonitor CRD 확인
[root@ip-192-168-78-195 ~ (iam-root-account@NRSON-EKS-CLUSTER.ap-northeast-2.eksctl.io:kuberhealthy)]# kubectl get servicemonitors -A
NAMESPACE      NAME                                                 AGE
kuberhealthy   kuberhealthy                                         2m45s
monitoring     prometheus-grafana                                   3h35m
monitoring     prometheus-kube-prometheus-alertmanager              3h35m
monitoring     prometheus-kube-prometheus-apiserver                 3h35m
monitoring     prometheus-kube-prometheus-coredns                   3h35m
monitoring     prometheus-kube-prometheus-kube-controller-manager   3h35m
monitoring     prometheus-kube-prometheus-kube-etcd                 3h35m
monitoring     prometheus-kube-prometheus-kube-proxy                3h35m
monitoring     prometheus-kube-prometheus-kube-scheduler            3h35m
monitoring     prometheus-kube-prometheus-kubelet                   3h35m
monitoring     prometheus-kube-prometheus-operator                  3h35m
monitoring     prometheus-kube-prometheus-prometheus                3h35m
monitoring     prometheus-kube-state-metrics                        3h35m
monitoring     prometheus-prometheus-node-exporter                  3h35m
[root@ip-192-168-78-195 ~ (iam-root-account@NRSON-EKS-CLUSTER.ap-northeast-2.eksctl.io:kuberhealthy)]#
위와 같이 Prometheus Operation이 Metric을 수집하기 위한 서비스 대상을 정의하는 servicemonitor CRD에 매핑된 정보를 확인할 수 있다.
kuberhealthy namespace의 kuberhealthy는 Prometheus 오퍼레이션과 연계하여 메트릭을 수집할 수 있도록 servicemonitor를 기본 지원한다.
[root@ip-192-168-78-195 ~ (iam-root-account@NRSON-EKS-CLUSTER.ap-northeast-2.eksctl.io:kuberhealthy)]# kubectl get Prometheus -A
NAMESPACE    NAME                                    VERSION   REPLICAS   AGE
monitoring   prometheus-kube-prometheus-prometheus   v2.34.0   1          3h36m
[root@ip-192-168-78-195 ~ (iam-root-account@NRSON-EKS-CLUSTER.ap-northeast-2.eksctl.io:kuberhealthy)]# kubectl get Prometheus prometheus-kube-prometheus-prometheus -n monitoring -o yaml
apiVersion: monitoring.coreos.com/v1
kind: Prometheus
metadata:
  annotations:
    meta.helm.sh/release-name: prometheus
    meta.helm.sh/release-namespace: monitoring
  creationTimestamp: "2022-04-05T03:25:23Z"
...
spec:
...
  serviceAccountName: prometheus-kube-prometheus-prometheus
  serviceMonitorNamespaceSelector: {}
  serviceMonitorSelector:
    matchLabels:
      release: prometheus
  shards: 1
  version: v2.34.0
[root@ip-192-168-78-195 ~ (iam-root-account@NRSON-EKS-CLUSTER.ap-northeast-2.eksctl.io:kuberhealthy)]#
prometheus에서는 servicemonitor 대상을 아래와 같이 두가지 규칙을 가지고 대상은 선정하게 된다.
- serviceMonitorNamespaceSelector : Prometheus pod는 기본 serviceMonitorNamespaceSelector: {}로 구성되며, 이는 Prometheus Pod가 기동된 monitoring namespace만 모니터링 대상으로 메트릭을 수집한다.
- serviceMonitorSelector : matchLabels이 release: prometheus인 Pod를 대상으로 메트릭을 수집한다.
위 기준을 충족하는지 확인하기 위해 kuberhealthy의 구성 정보를 확인해 보도록 하자.
[root@ip-192-168-78-195 ~ (iam-root-account@NRSON-EKS-CLUSTER.ap-northeast-2.eksctl.io:kuberhealthy)]# kubectl get servicemonitors kuberhealthy -o yaml
apiVersion: monitoring.coreos.com/v1
kind: ServiceMonitor
metadata:
  name: kuberhealthy
  namespace: kuberhealthy
  annotations:
    meta.helm.sh/release-name: kuberhealthy
    meta.helm.sh/release-namespace: kuberhealthy
  creationTimestamp: "2022-04-05T06:58:26Z"
  generation: 1
  labels:
    app: kuberhealthy
    app.kubernetes.io/managed-by: Helm
    prometheus: prometheus
    release: prometheus-operator
...
spec:
  endpoints:
  - bearerTokenFile: /var/run/secrets/kubernetes.io/serviceaccount/token
    interval: 15s
    port: http
  jobLabel: component
  namespaceSelector:
    matchNames:
    - kuberhealthy
  selector:
    matchLabels:
      app: kuberhealthy
[root@ip-192-168-78-195 ~ (iam-root-account@NRSON-EKS-CLUSTER.ap-northeast-2.eksctl.io:kuberhealthy)]#
위와 같이 kuberhealthy는 kuberhealthy namespace 내 release: prometheus-operator label을 갖고 있다. 따라서 현재 상태로는 prometheus에서는 메트릭 수집 대상에서 제외된다.
b. kuberhealthy 구성 변경
[root@ip-192-168-78-195 ~ (iam-root-account@NRSON-EKS-CLUSTER.ap-northeast-2.eksctl.io:kuberhealthy)]# kubectl get servicemonitors kuberhealthy -o yaml > kuberhealty_servicemonitor.yaml
[root@ip-192-168-78-195 ~ (iam-root-account@NRSON-EKS-CLUSTER.ap-northeast-2.eksctl.io:kuberhealthy)]# vi kuberhealty_servicemonitor.yaml
apiVersion: monitoring.coreos.com/v1
kind: ServiceMonitor
metadata:
  name: kuberhealthy
  namespace: monitoring
  annotations:
    meta.helm.sh/release-name: kuberhealthy
    meta.helm.sh/release-namespace: kuberhealthy
  creationTimestamp: "2022-04-05T06:58:26Z"
  generation: 1
  labels:
    app: kuberhealthy
    app.kubernetes.io/managed-by: Helm
    prometheus: prometheus
    release: prometheus
...
spec:
  endpoints:
  - bearerTokenFile: /var/run/secrets/kubernetes.io/serviceaccount/token
    interval: 15s
    port: http
  jobLabel: component
  namespaceSelector:
    matchNames:
    - kuberhealthy
  selector:
    matchLabels:
      app: kuberhealthy
[root@ip-192-168-78-195 ~ (iam-root-account@NRSON-EKS-CLUSTER.ap-northeast-2.eksctl.io:kuberhealthy)]# kubectl apply -f kuberhealty_servicemonitor.yaml
servicemonitor.monitoring.coreos.com/kuberhealthy created
[root@ip-192-168-78-195 ~ (iam-root-account@NRSON-EKS-CLUSTER.ap-northeast-2.eksctl.io:kuberhealthy)]# kubectl get servicemonitors -A
NAMESPACE      NAME                                                 AGE
kuberhealthy   kuberhealthy                                         5m49s
monitoring     kuberhealthy                                         9s
monitoring     prometheus-grafana                                   3h38m
monitoring     prometheus-kube-prometheus-alertmanager              3h38m
monitoring     prometheus-kube-prometheus-apiserver                 3h38m
monitoring     prometheus-kube-prometheus-coredns                   3h38m
monitoring     prometheus-kube-prometheus-kube-controller-manager   3h38m
monitoring     prometheus-kube-prometheus-kube-etcd                 3h38m
monitoring     prometheus-kube-prometheus-kube-proxy                3h38m
monitoring     prometheus-kube-prometheus-kube-scheduler            3h38m
monitoring     prometheus-kube-prometheus-kubelet                   3h38m
monitoring     prometheus-kube-prometheus-operator                  3h38m
monitoring     prometheus-kube-prometheus-prometheus                3h38m
monitoring     prometheus-kube-state-metrics                        3h38m
monitoring     prometheus-prometheus-node-exporter                  3h38m
[root@ip-192-168-78-195 ~ (iam-root-account@NRSON-EKS-CLUSTER.ap-northeast-2.eksctl.io:kuberhealthy)]# kubectl delete servicemonitor kuberhealthy -n kuberhealthy
servicemonitor.monitoring.coreos.com "kuberhealthy" deleted
[root@ip-192-168-78-195 ~ (iam-root-account@NRSON-EKS-CLUSTER.ap-northeast-2.eksctl.io:kuberhealthy)]#
위와 같이 kuberhealthy의 yaml 파일을 내려 받아 모니터링 대상으로 지정하기 위해 namespace를 monitoring으로 lebel을 release: prometheus로 수정한 후 반영한다.
또한 불필요한 기존 kuberhealthy namespace 내에 생성한 kuberhealthy는 삭제한다.
4. 대시보드 구성
a. Prometheus Service Discovery 확인
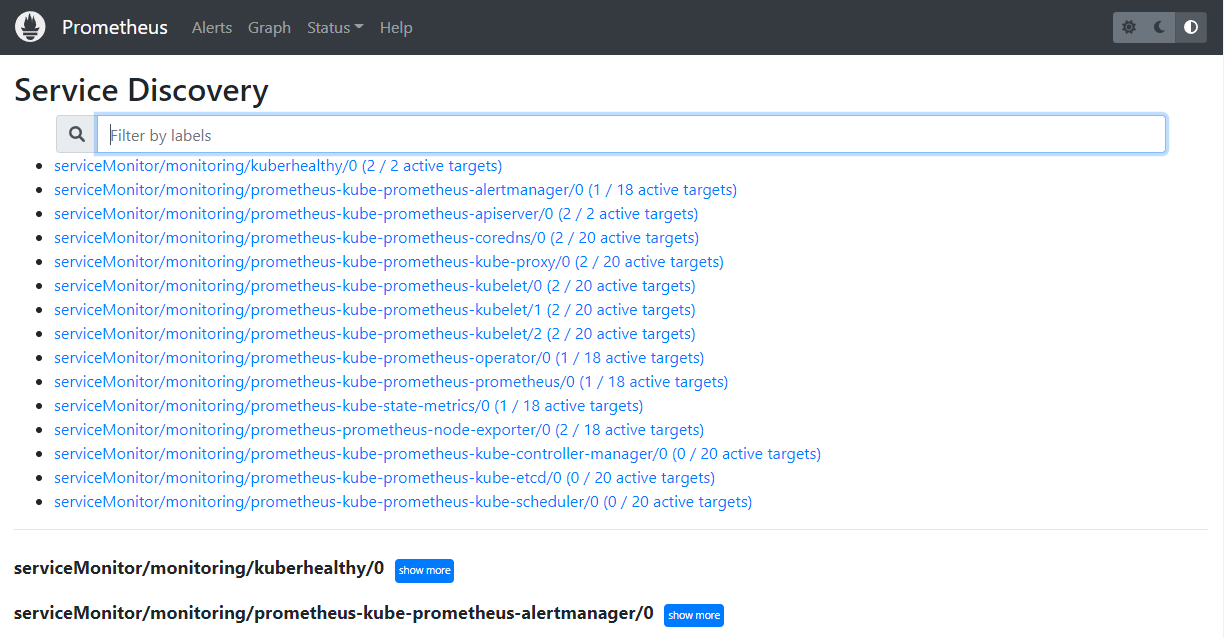
Service Discovery는 현재 메트릭을 수집하고 있는 대상 서비스 목록이다. 위와 같이 serviceMonitor/monitoring/kuberhealthy/0 (2/2 active targets)이 탐색되는 것을 확인할 수 있다.
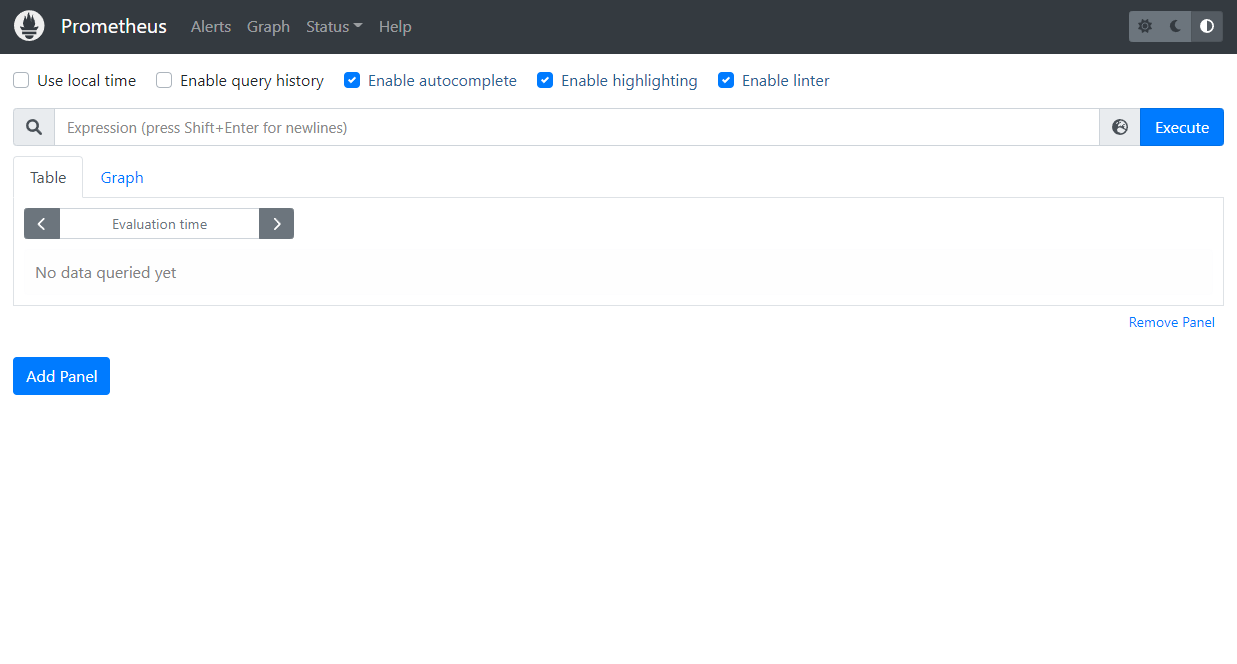
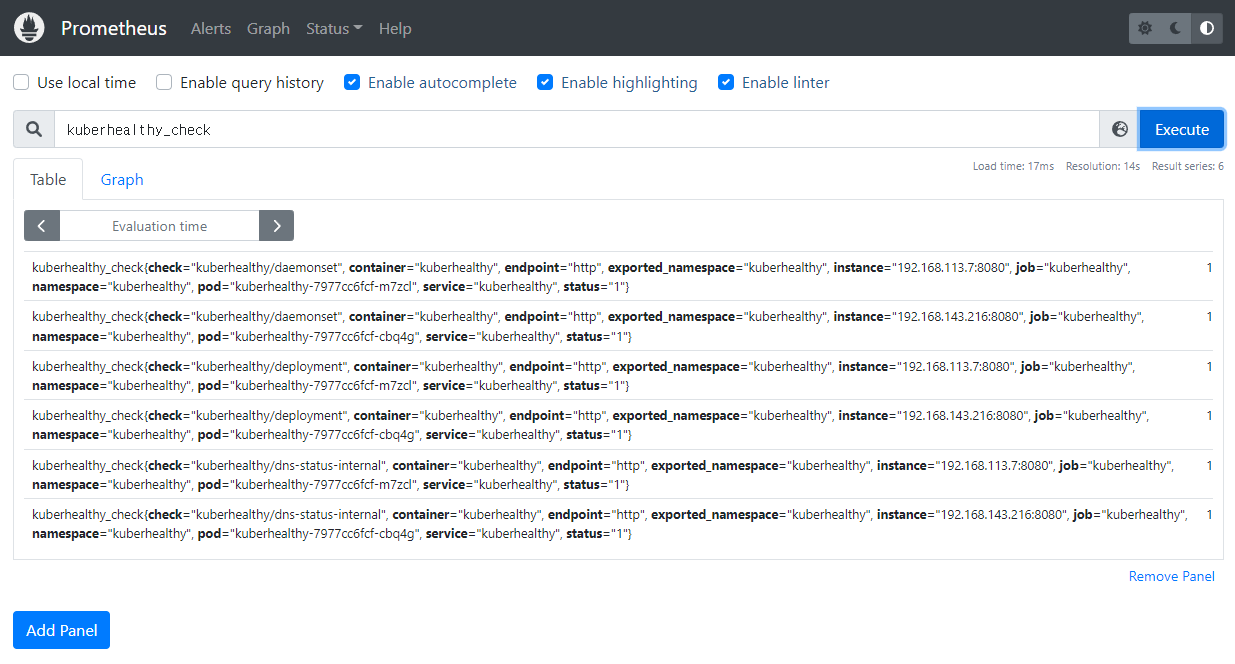
b. Graph 확인
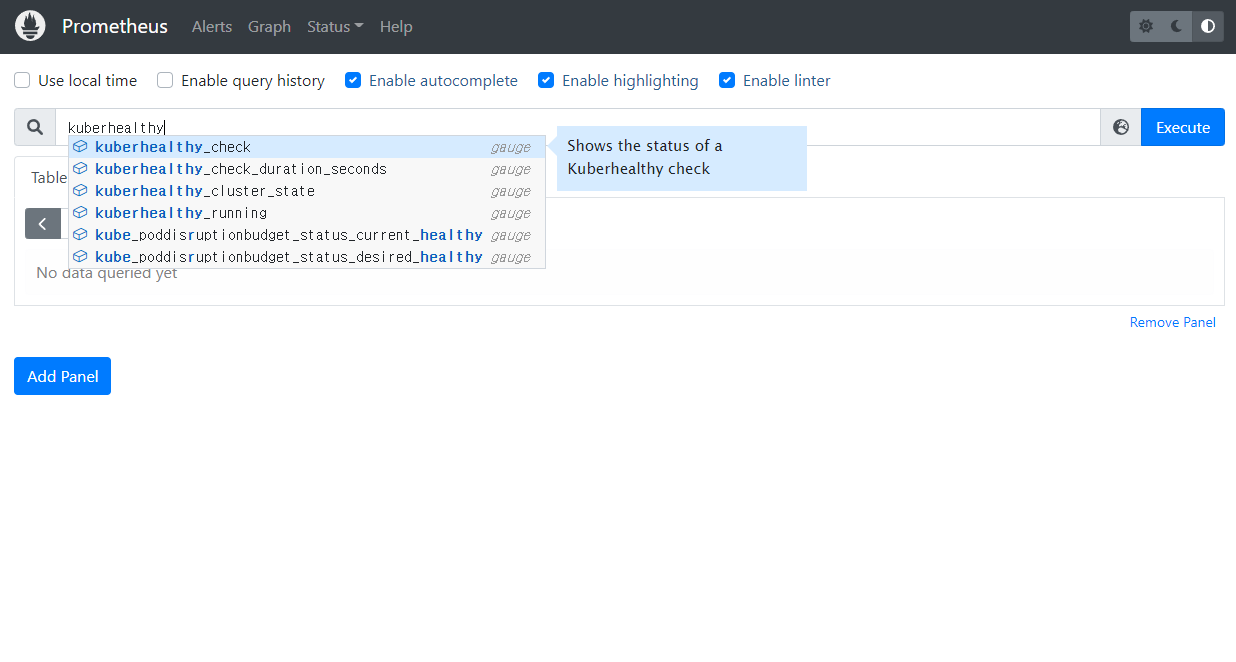
Prometheus Graph 탭에서 graph를 생성하기 위한 데이터가 조회되는지 확인한다. 위와 같이 kuberhealthy_check > Excute 클릭 시 아래와 같이 결과가 표출될 경우 정상적으로 kuberhealthy와 prometheus의 연동은 완료된다.
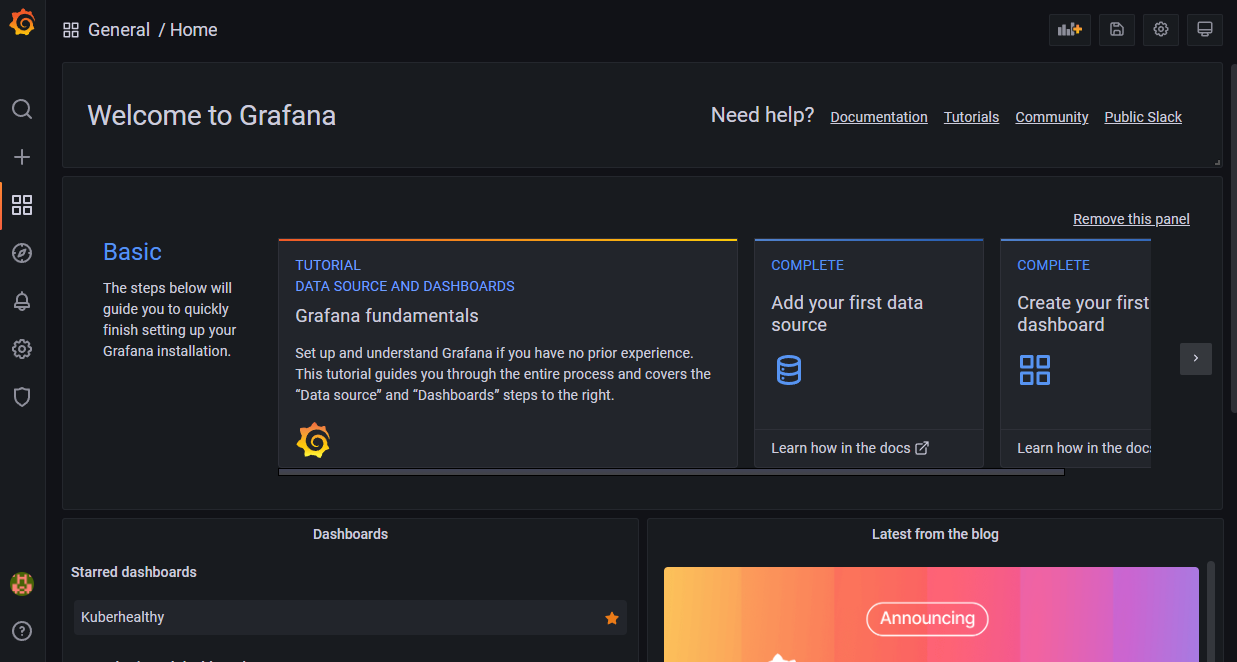
c. Grafana 대시보드 확인
Grafana 대시보드를 자동 생성하기 위해 아래 json 파일을 다운로드 받는다.
https://github.com/Comcast/kuberhealthy/blob/master/deploy/grafana/dashboard.json
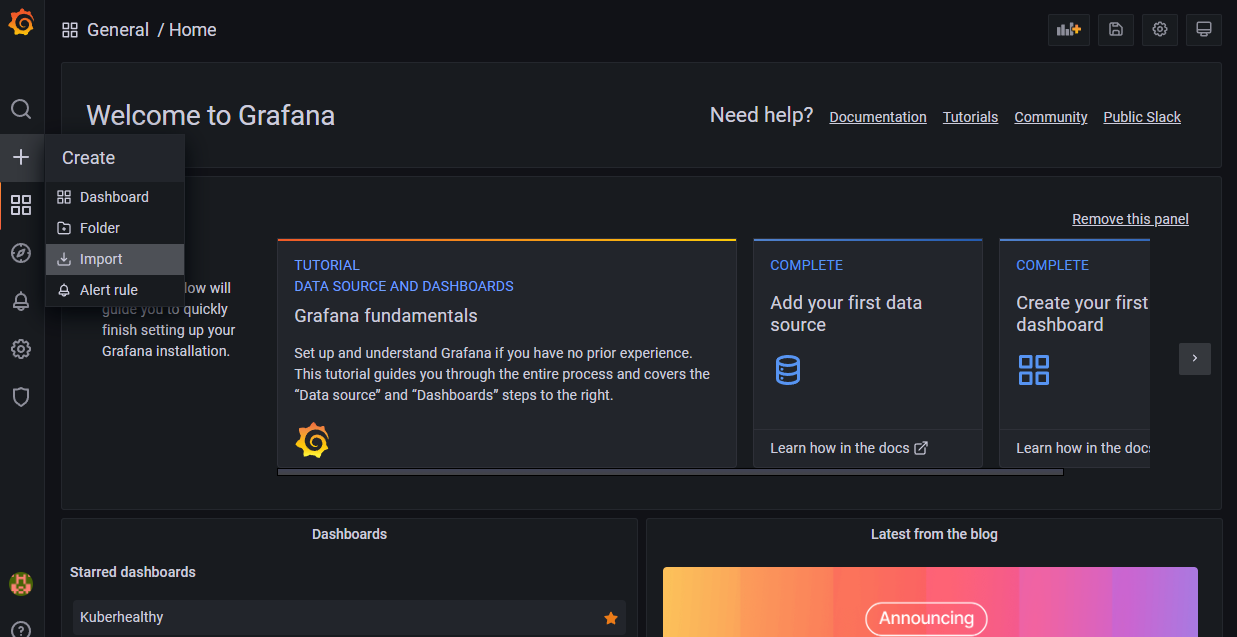
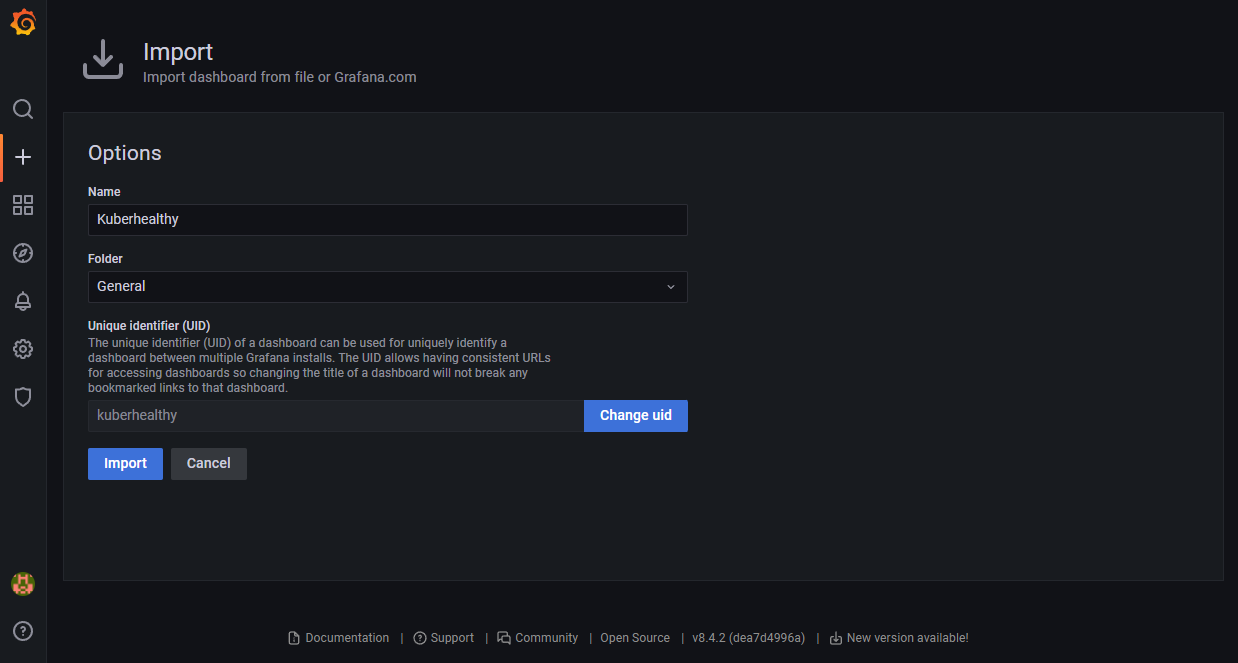
+(Creat) > Import 버튼 클릭 후 json 파일을 import 한다.
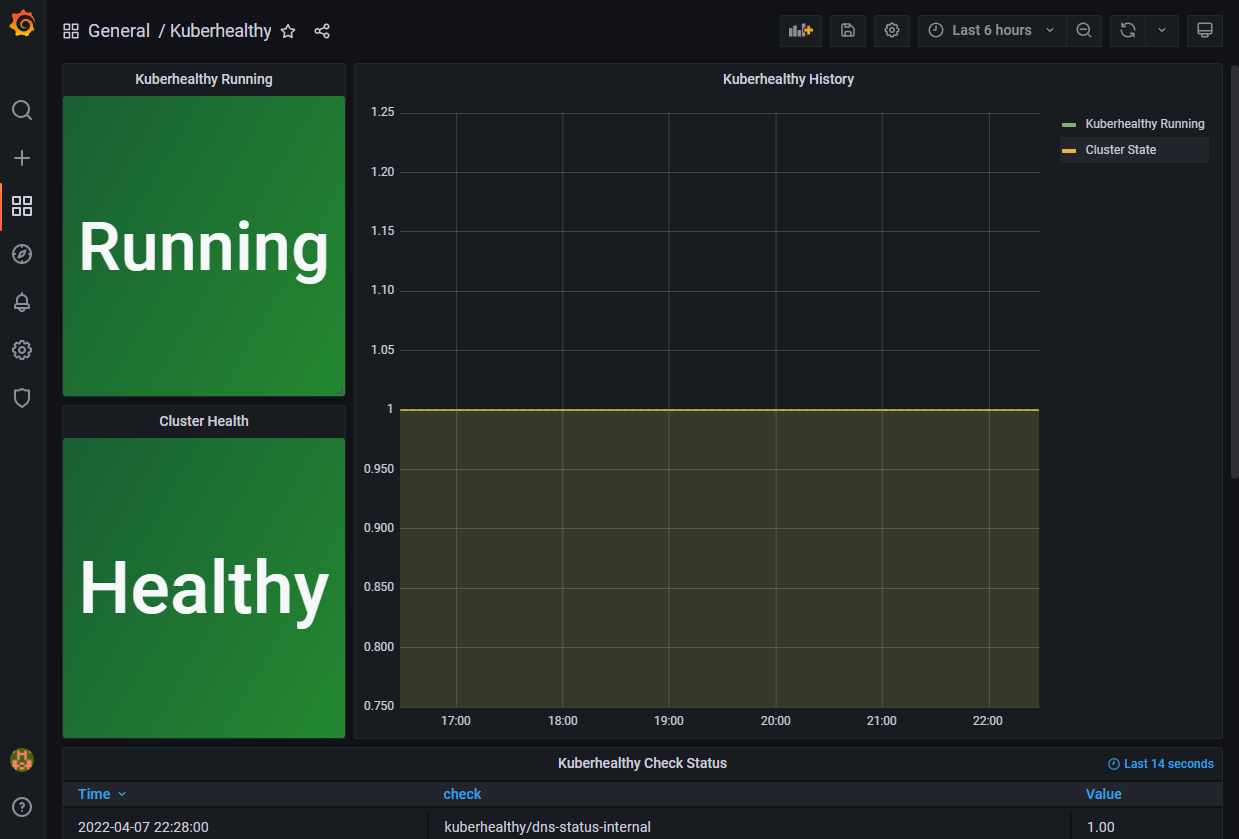
위와 같이 정상적으로 생성이 완료되면 kuberhealthy 메트릭에 대한 Grafana 대시보드를 확인할 수 있다.
'③ 클라우드 > ⓚ Kubernetes' 카테고리의 다른 글
| Kubernetes Node 가용성 검증 (0) | 2022.08.10 |
|---|---|
| Kubernetes Multi Container Design Pattern (0) | 2022.06.26 |
| StorageClass를 활용한 Dynamic Provisioning (0) | 2022.04.02 |
| Kubernetes 네트워크 ACL "NetworkPolicy" (0) | 2022.03.19 |
| Kubernetes 보안 강화를 위한 오픈소스 소프트웨어 활용 (0) | 2022.03.14 |
- Total
- Today
- Yesterday
- SWA
- nodejs
- JEUS6
- openstack token issue
- 쿠버네티스
- 마이크로서비스 아키텍처
- k8s
- OpenStack
- git
- webtob
- aa
- openstack tenant
- Da
- wildfly
- node.js
- kubernetes
- JEUS7
- Architecture
- Docker
- TA
- API Gateway
- 아키텍처
- 오픈스택
- 마이크로서비스
- SA
- JBoss
- aws
- MSA
- jeus
- apache
| 일 | 월 | 화 | 수 | 목 | 금 | 토 |
|---|---|---|---|---|---|---|
| 1 | 2 | 3 | 4 | 5 | 6 | |
| 7 | 8 | 9 | 10 | 11 | 12 | 13 |
| 14 | 15 | 16 | 17 | 18 | 19 | 20 |
| 21 | 22 | 23 | 24 | 25 | 26 | 27 |
| 28 | 29 | 30 |